Category: Reporting

  • Google Ads Dashboard: Automated PPC Reporting for Clients

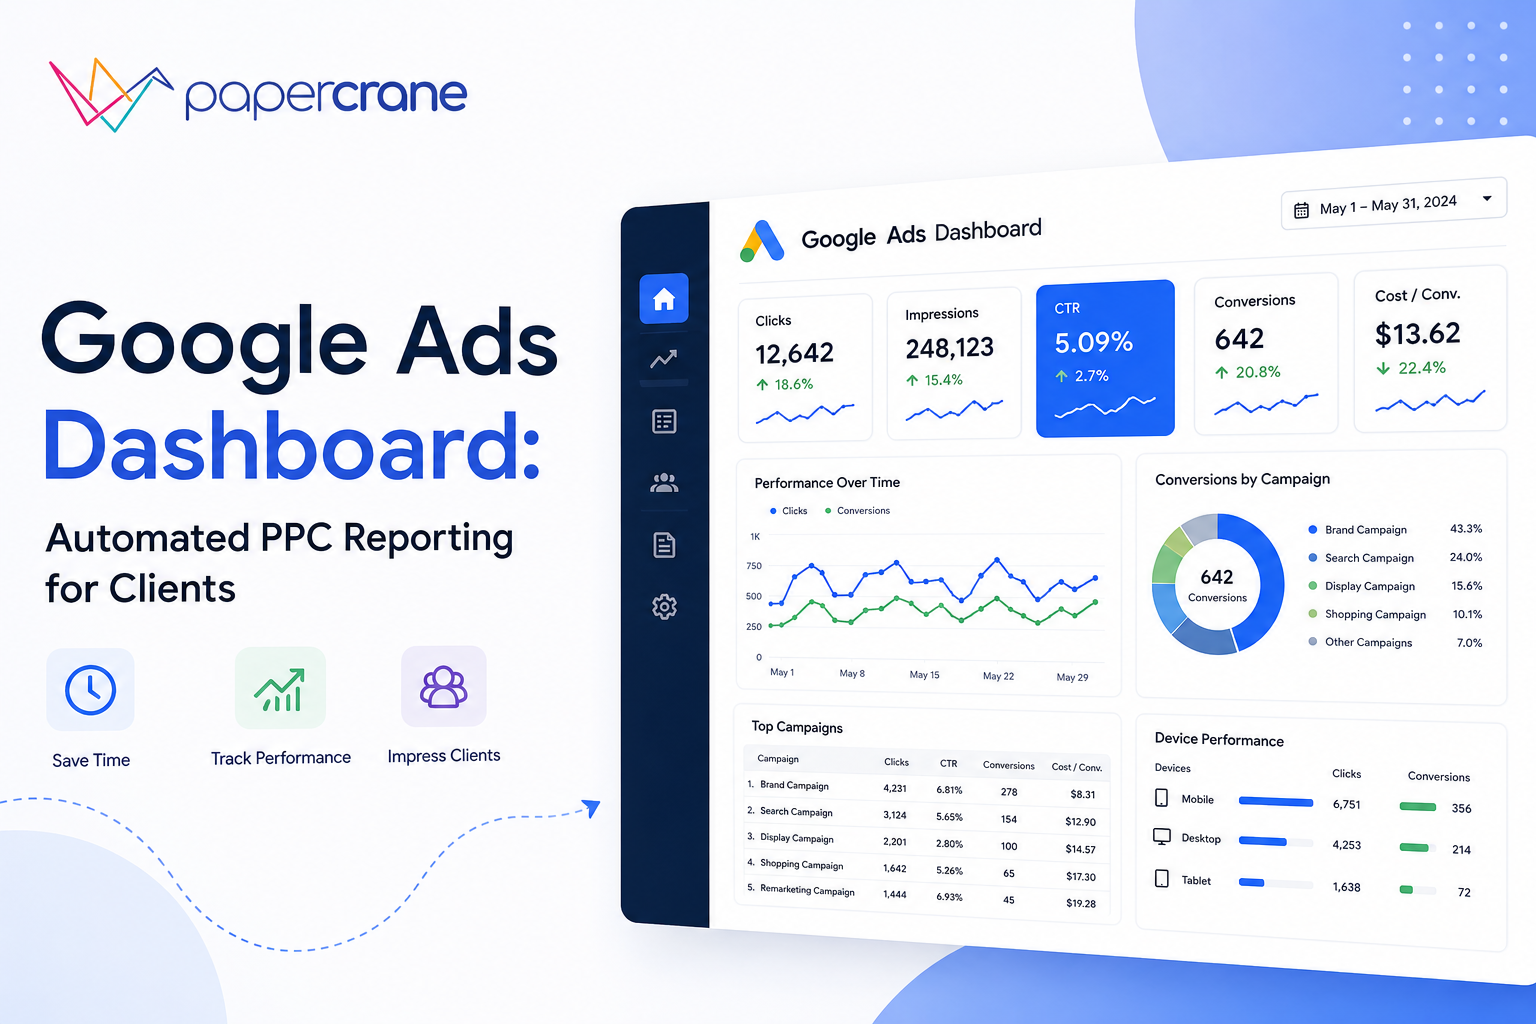
    Google Ads Dashboard: Automated PPC Reporting for Clients

    A client messages you at 4:47pm on a Friday: “Why did conversions drop this week?” You have the answer somewhere, across three MCC accounts and a spreadsheet you last updated on Tuesday. By the time you’ve exported CSVs and rebuilt the chart, the client has already drawn their own conclusion.

    This is the actual problem a google ads dashboard is supposed to solve for agencies not “tracking metrics in one place”. If your reporting setup can’t do that, it’s not a dashboard. It’s a delay with a nicer font.

    Why the Standard Google Ads Dashboard Breaks Down for Agencies

    Google’s native interface was built for one advertiser looking at their own account, not an agency managing twenty. The MCC view isn’t client-safe, you can’t hand a client a login without exposing every other account you manage.

    There’s no white-labeling, no automated client-facing export, and every time Google rolls out a redesign, saved views and custom columns can shift or disappear without warning.

    Some people still search for this under its old name, the adwords dashboard but the limitation hasn’t changed with the rebrand: it’s an internal tool, not a client communication tool.

    If you want your Google Ads account feeding a system built for sharing, not just viewing, you can connect your Google Ads account directly rather than exporting from the native interface. For reference on what the native interface actually supports, Google’s own Ads Help Center documents the current dashboard layout is worth checking before you assume a feature exists.

    The Real Cost: Hours, Not Just Hassle

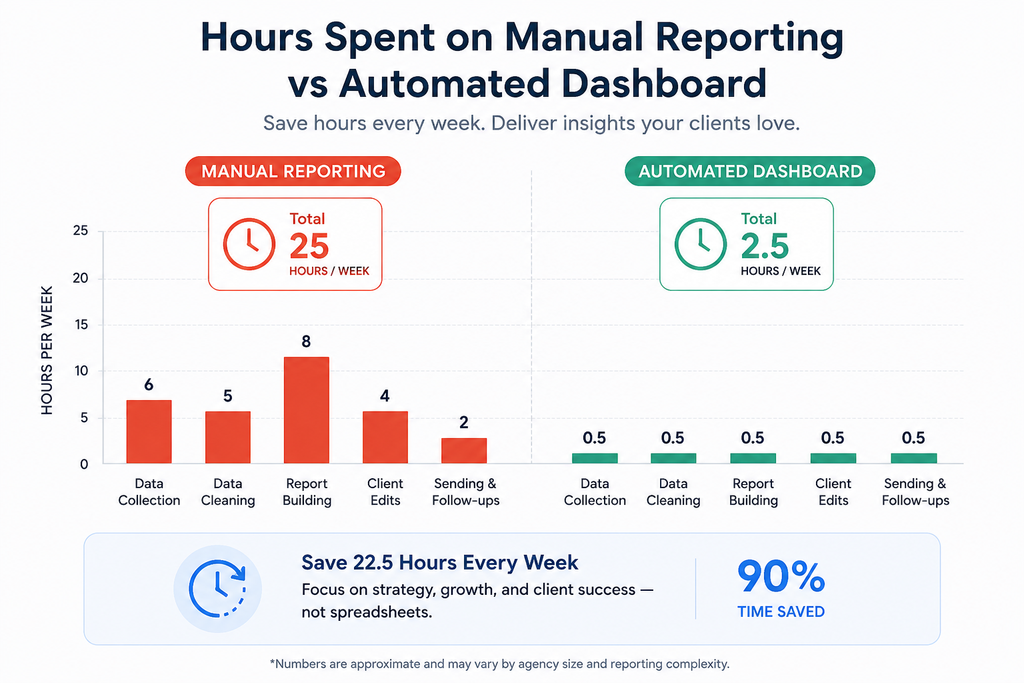
    Agencies that cross roughly 10 hours a week on manual reporting are already past the point where a spreadsheet makes sense.

    That’s not a rule of thumb, it’s the threshold where the labor cost of manual google ads reporting exceeds what a reporting tool costs to run. Every hour spent formatting a slide deck is an hour not spent adjusting bids, testing ad copy, or catching a budget pacing issue before it burns through spend.

    Multiply that by every client on your roster, and “we’ll just export it manually” stops being a scrappy habit and starts being the reason your best account manager is doing data entry instead of strategy.
    The Trust Problem. Not Just the Time Problem

    Here’s what most articles on this topic miss: clients don’t churn because performance dipped. They churn because they felt out of the loop when it did. A monthly report is a monologue, you talk, they listen, and for the 29 days in between, they’re guessing. A live ppc dashboard changes that dynamic entirely. Instead of “prove it to me at the end of the month,” the client can check in whenever they want, which means the conversation you have on a call is about strategy, not about defending a number they’re seeing for the first time.

    This is the gap most Google Ads dashboard content ignores. Metrics matter, but access to metrics on the client’s schedule, not yours is what actually protects the relationship.

    What a Proper PPC Dashboard Actually Needs

    A dashboard that’s built for agency-client reporting, not just personal account tracking. It needs to cover a few non-negotiables:

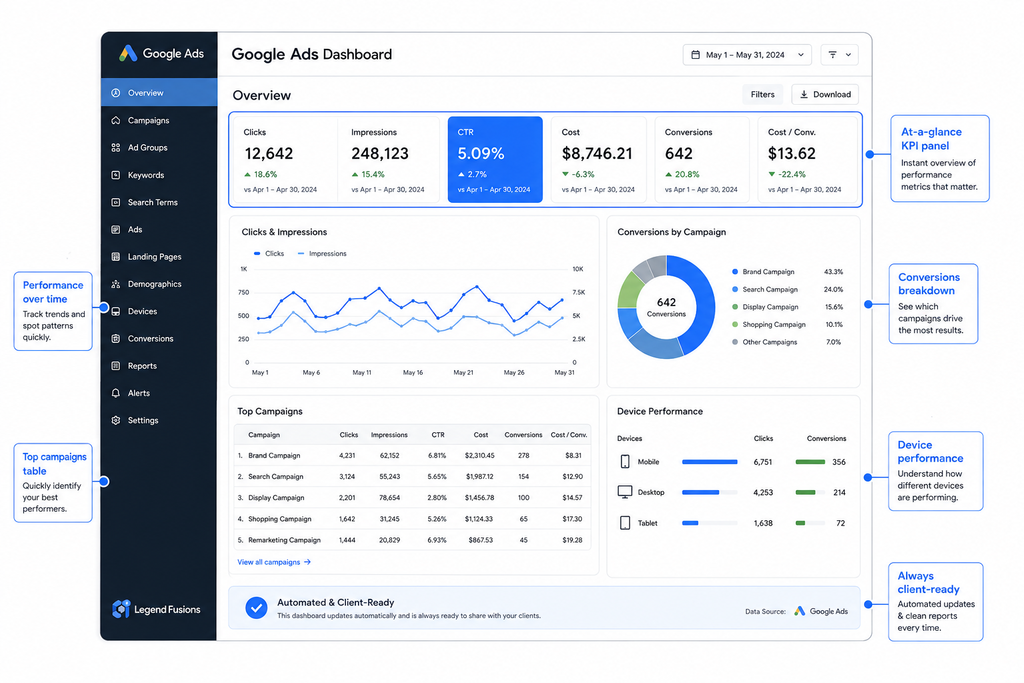
    • The right KPIs, not vanity metrics. A google ads kpi dashboard should surface CPA, ROAS, conversion rate, and pacing against goal. It is not just about impressions and clicks, which look good and mean little.
    • Live data, not stale exports. If the client is looking at numbers from three days ago, you haven’t solved the trust problem, you’ve just made the delay prettier.
    • White-labeling without asterisks. Many tools gate full brand removal like custom domain, custom sender, and no vendor logo, behind a higher-priced tier. Check this before you commit, not after a client spots someone else’s logo on your report.
    • Multi-client, multi-account support. Agencies need to move between accounts without re-authenticating or rebuilding views from scratch.
    • Anomaly alerts. A ppc reporting dashboard that only reports monthly can’t warn you about a budget pacing issue on day 4.
    How Papercrane Closes These Gaps

    Papercrane connects directly to your Google Ads account through the API, no CSV exports, no manual copy-paste into slide decks. Every agency client gets a fully white-labeled google ads performance dashboard, with no gated tier hiding your own branding behind theirs.

    The setup is three steps:

    1. Connect your Google Ads account (and any others you manage).
    2. Select KPIs relevant to that client’s goals, using pre-built templates or a custom view.
    3. Share a live link, or schedule automated email or Slack digests on whatever cadence the client actually wants.

    Want to see what’s actually included versus what’s gated elsewhere? See how white-label reporting works for agencies for a closer look. And if you want the technical detail on what a direct API connection can pull that a manual export can’t, Google’s Google Ads API documentation covers the data available at that level.

    FAQ

    What is a Google Ads dashboard?

    A Google Ads dashboard is a visual interface either Google’s native tool or a third-party platform. It displays campaign metrics like clicks, conversions, CPA, and ROAS in one place instead of raw account data.

    How do I create an automated Google Ads report for clients?

    Connect your Google Ads account to a reporting platform via API, select the KPIs relevant to the client, and schedule automatic delivery by live link, email, or Slack. No need of manually building reports each period.

    Is a Google Ads dashboard the same as an Adwords dashboard?

    Yes. Google Ads was formerly called Google AdWords, so “Adwords dashboard” and “Google Ads dashboard” refer to the same tool under its old and current names.

    How much time does automated PPC reporting save?

    Agencies manually building reports typically spend several hours per client each week; automated dashboards remove most of that by pulling live data directly instead of requiring manual exports and formatting.

    What’s Next?

    A google ads dashboard built for agencies isn’t about prettier charts. It’s about giving clients access before they have to ask, and giving your team back the hours currently lost to formatting instead of optimizing.

    Start your free Google Ads dashboard and see the difference between a report a client waits for and one they can already see.
  • Facebook & Meta Ads Dashboard: Client-Ready Reporting on Autopilot

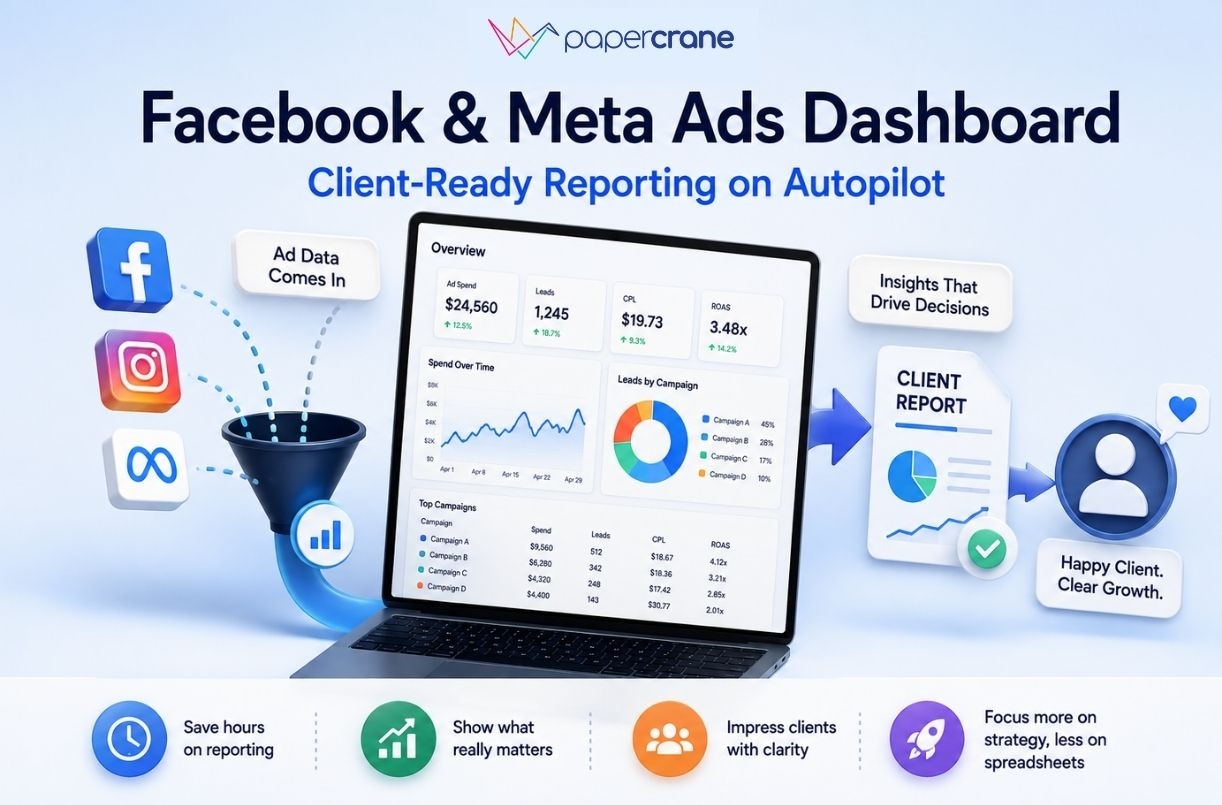
    Facebook & Meta Ads Dashboard: Client-Ready Reporting on Autopilot

    Your Meta Ads campaigns are running. The data is there. The client still wants answers.

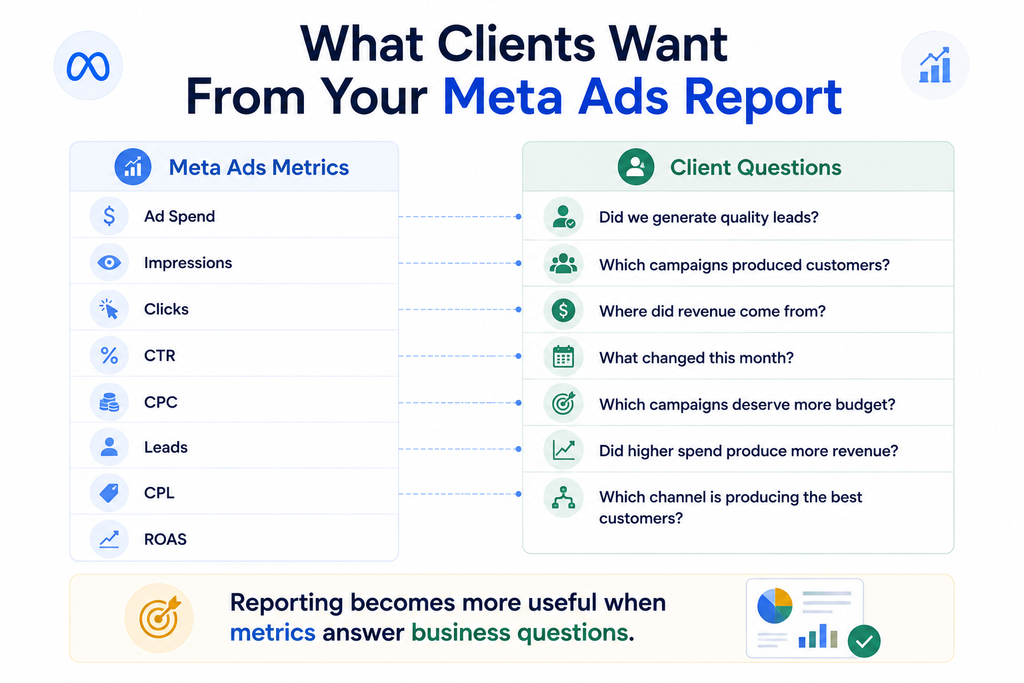
    Which campaigns generated the best leads? Which ads drove revenue? Why did CPL increase? What changed from last month? Where should the budget move next?

    A Facebook Ads dashboard should help answer those questions without turning every client report into another manual project.

    For agencies, the problem is rarely a lack of data. It is turning Meta Ads data into a clear client story, then doing it again for every account.

    Your Meta Ads Report Has the Numbers. Does It Answer the Client?

    Meta Ads Manager gives you a detailed view of advertising performance. You have spend, impressions, clicks, conversions, cost per result and other campaign metrics. Meta also provides reporting and performance data through its advertising tools.

    But clients often ask questions beyond those metrics.

    They might ask:

    • Which campaign generated the most qualified leads?
    • Which ads produced customers?
    • How did this month’s results compare with last month?
    • Which campaigns deserve more budget?
    • Did the extra ad spend produce more revenue?

    A typical Facebook advertising dashboard might show:

    Spend → Clicks → Leads → CPL → ROAS

    The client might be thinking:

    Spend → Qualified leads → Customers → Revenue

    Those are two different reporting needs.

    Your job as the agency is to connect them.

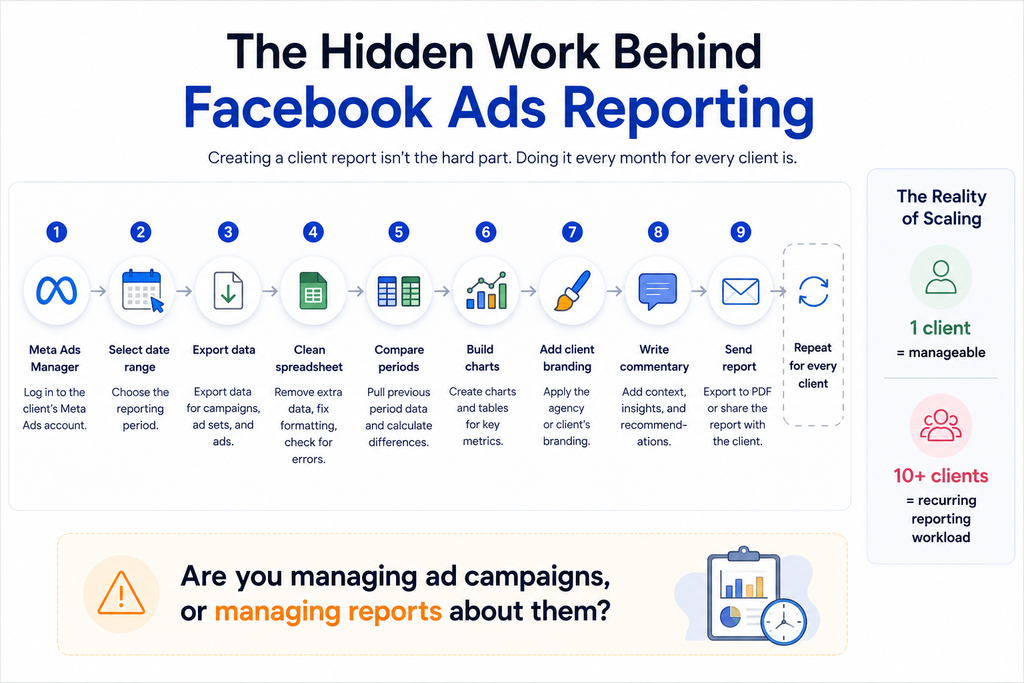
    Why Facebook Ads Reporting Gets Repetitive for Agencies

    The monthly reporting process often looks simple from the outside.

    Open the client’s Meta account.

    Select the date range.

    Pull the numbers.

    Check the previous period.

    Update the charts.

    Add commentary.

    Apply the agency branding.

    Export the report.

    Send it to the client.

    Then do it again.

    And again.

    One account is manageable. The problem grows when your agency manages 10, 20 or 30 accounts with different goals and different data sources.

    A B2B client might care about leads and pipeline.

    An ecommerce client might care about purchases and revenue.

    A lead generation client might care about qualified leads and cost per acquisition.

    The same Facebook Ads report template does not fit all three.

    This is why agencies often end up maintaining spreadsheets, dashboards and reporting templates alongside Meta Ads Manager. The reporting itself becomes another recurring production task.

    A Facebook Ads Dashboard Still Needs More Than Meta Data

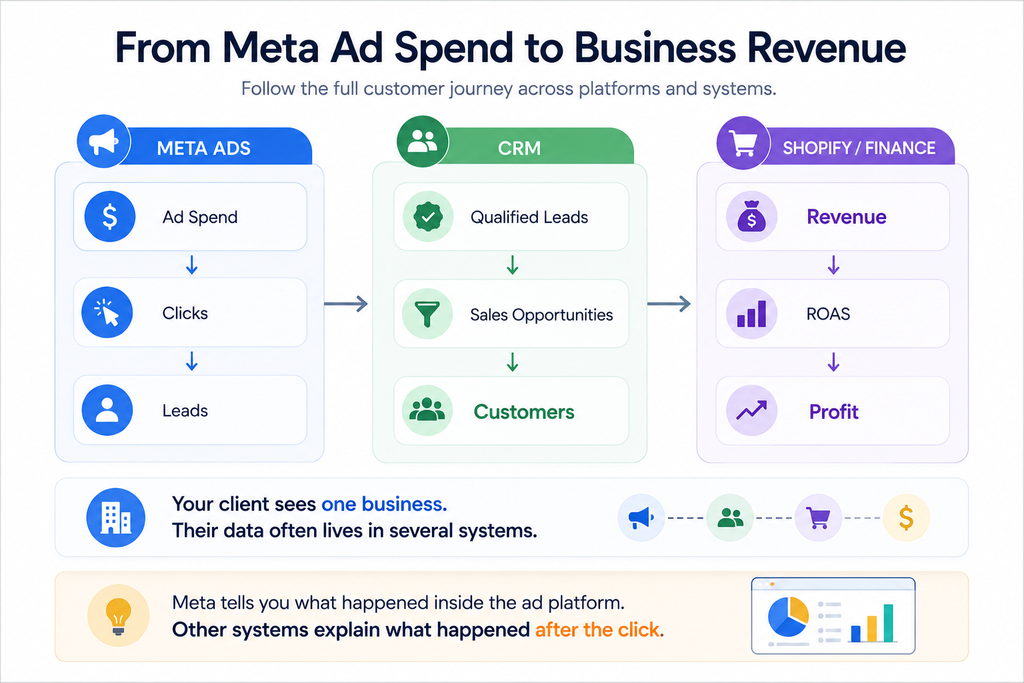
    A dashboard full of Meta metrics does not automatically give you the full business picture.

    Consider a lead generation campaign.

    Meta reports:

    • $20,000 ad spend
    • 500 leads
    • $40 cost per lead
    • 2.8x ROAS

    The CRM reports:

    • 310 qualified leads
    • 82 sales appointments
    • 31 new customers

    The finance system reports:

    • $74,000 collected revenue

    Now the client has a better question.

    Which campaigns generated the customers and revenue?

    Answering it requires more than a Meta Ads dashboard. It requires the advertising data and the business data to work together.

    This is where a social media ads dashboard becomes more useful than a collection of platform reports.

    The dashboard should connect the journey:

    Ad spend → Leads → Qualified leads → Customers → Revenue

    The goal is not to replace Meta Ads Manager. It is to give the client a clearer view of what the advertising activity means for the business.

    What Should a Client-Ready Meta Ads Dashboard Show?

    The best dashboard depends on the client’s goal.

    For lead generation, start with:

    • Ad spend
    • Leads
    • Cost per lead
    • Qualified leads
    • Cost per qualified lead
    • Customers
    • Revenue

    For ecommerce, focus on:

    • Ad spend
    • Purchases
    • Cost per purchase
    • Revenue
    • ROAS
    • Average order value
    • Conversion rate

    For campaign analysis, add:

    • Campaign performance
    • Ad set performance
    • Creative performance
    • CTR
    • CPC
    • Conversion rate
    • Period-over-period changes

    The important part is the order.

    Start with the business outcome.

    Then show the metrics explaining the outcome.

    For example:

    Revenue → ROAS → Campaigns → Ad sets → Creatives

    This gives the client a path from the result to the detail.

    How Papercrane Turns Meta Ads Reporting Into a Live Dashboard

    Papercrane connects Facebook Ads with other data sources, including Google Ads, LinkedIn Ads, Shopify, HubSpot, Google Analytics and more.

    The workflow is simple.

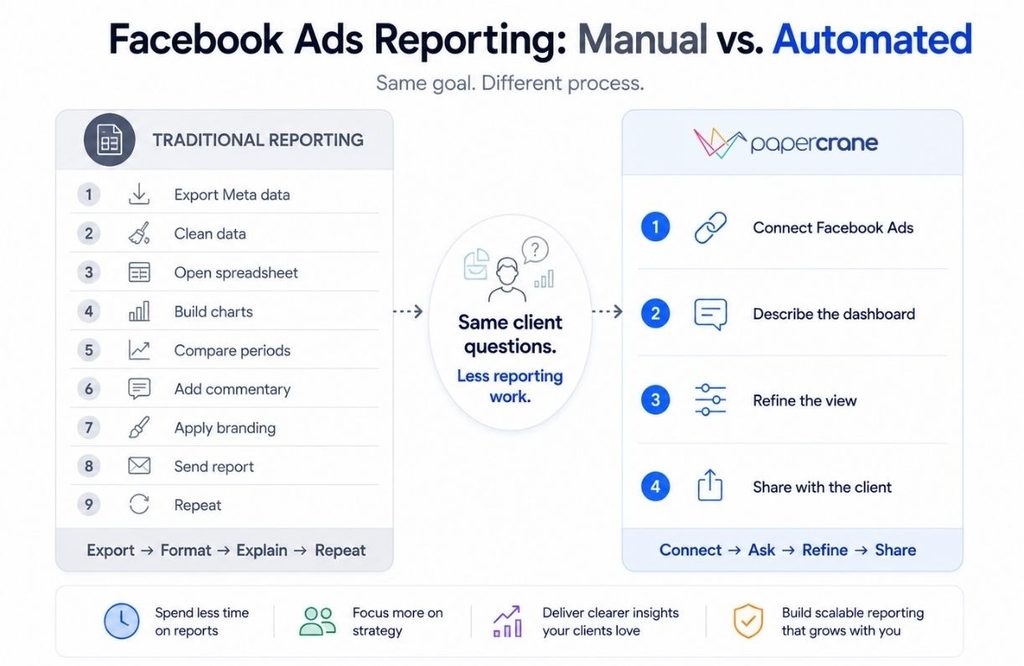
    1. Connect

    Connect the client’s Facebook Ads data.

    2. Ask

    Describe the dashboard you need in plain language.

    For example:

    “Build a client dashboard showing Meta ad spend, leads, CPL, ROAS and campaign performance for the last 30 days.”

    3. Refine

    Ask for changes without rebuilding the dashboard from scratch.

    “Add month-over-month changes.”

    “Show our five best campaigns.”

    “Add revenue from Shopify.”

    “Highlight campaigns where CPL increased.”

    4. Share

    Share the finished dashboard with the client.

    Papercrane’s current workflow follows the same basic model. Connect your data, ask for the dashboard you need, then share it through a link.

    For agencies, Papercrane also supports branded client-facing dashboards and multiple data sources across different client setups.

    See how Papercrane works for agencies

    What Changes When Reporting Runs This Way?

    The biggest change is where your team spends its time.

    Traditional workflow:

    Export → Clean → Format → Compare → Write → Send → Repeat

    Papercrane workflow:

    Connect → Ask → Refine → Share

    The difference becomes more useful when client requirements vary.

    Imagine your agency manages three accounts.

    Client A is a B2B company.

    Their dashboard combines Meta Ads and HubSpot.

    They need:

    Leads → Qualified leads → Pipeline → Revenue

    Client B is an ecommerce brand.

    Their dashboard combines Meta Ads and Shopify.

    They need:

    Spend → Purchases → Revenue → ROAS

    Client C is a lead generation company.

    Their dashboard combines Meta Ads and a CRM.

    They need:

    Spend → Leads → Qualified leads → Cost per qualified lead

    You do not need to force every client into the same Facebook Ads report template.

    You build the dashboard around the client’s actual reporting question.

    Papercrane’s agency content follows this same approach, with different dashboard structures for B2B, ecommerce and SEO reporting.

    Three Client Questions Your Dashboard Should Answer

    A useful Meta Ads dashboard should help you answer three levels of questions.

    What happened?

    “Spend increased 18% and leads increased 11%.”

    Why did it happen?

    “Campaign B produced most of the additional leads, but its cost per lead also increased.”

    What should we look at next?

    “Campaign C has lower spend but stronger lead quality. Compare its pipeline performance before increasing budget.”

    This is where reporting becomes more valuable than a monthly collection of numbers.

    The client gets context.

    Your account manager gets a faster way to explain performance.

    Your media buyer gets a clearer view of where to investigate.

    How to Build a Client-Ready Facebook Ads Dashboard With Papercrane

    You do not need to start with a finished dashboard template.

    Start with the client’s reporting question.

    1. Connect Facebook Ads.
    2. Describe the KPIs and date range you need.
    3. Add another data source if the question crosses platforms.
    4. Ask for campaign, channel or period comparisons.
    5. Refine the dashboard based on the client’s reporting needs.
    6. Share the finished dashboard.

    For example:

    “Show Meta spend, leads, CPL and ROAS by campaign. Compare the last 30 days with the previous 30 days.”

    Then:

    “Add Shopify revenue and show ROAS based on actual revenue.”

    The dashboard evolves around the question instead of forcing the question into a fixed report.

    Connect your data sources with Papercrane

    Facebook Ads Reporting FAQs

    What should a Facebook Ads dashboard include?

    Start with the metrics tied to the client’s goal. Common metrics include spend, impressions, clicks, leads, CP, CPA, ROAS, revenue and conversion rate.

    What is the difference between Facebook Ads reporting and Meta Ads reporting?

    Facebook Ads reporting often refers to advertising performance on Facebook. Meta Ads reporting covers the broader Meta advertising ecosystem, including Facebook and Instagram.

    Is a Facebook Ads report template enough for client reporting?

    A template works well when every client needs the same metrics. It becomes restrictive when clients need different KPIs or data from other systems.

    How do agencies automate Meta Ads reporting?

    Agencies typically connect advertising data to a reporting platform, create dashboards or templates, refresh the data and share reports with clients. Papercrane adds an AI-driven workflow where teams describe the dashboard they need and refine it through natural-language requests.

    Can a Meta Ads dashboard include CRM or ecommerce data?

    Yes, when the reporting platform supports those data sources. This gives agencies a view of advertising performance alongside leads, customers or revenue.

    Stop Rebuilding the Same Meta Ads Report

    Your clients do not need another spreadsheet full of advertising metrics.

    They need answers.

    Which campaigns worked?

    Why did performance change?

    Which leads became customers?

    Where did the revenue come from?

    What deserves attention next?

    A client-ready Facebook Ads dashboard should bring those answers into one place and pricing of Papercrane is also affordable.

    With Papercrane, you connect the data, describe the dashboard, refine it as requirements change and share it with the client.

    Build client-ready dashboards with Papercrane

  • HubSpot Reporting Dashboard: What Native Reports Miss

    HubSpot Reporting Dashboard: What Native Reports Miss

    You built the report. Then someone asked a question it can’t answer, because the data lives in two objects HubSpot won’t let you join, or in a tool HubSpot has never heard of.

    This is the point where most teams start searching for “hubspot reporting dashboard,” and it’s usually not curiosity. It’s a specific report that’s stuck.

    We cover why native HubSpot reporting hits that wall, what a custom HubSpot CRM dashboard actually needs to do instead, and how to build one without waiting on a subscription upgrade or a dev sprint.

    Why Teams Hit a Wall With HubSpot’s Native Reporting

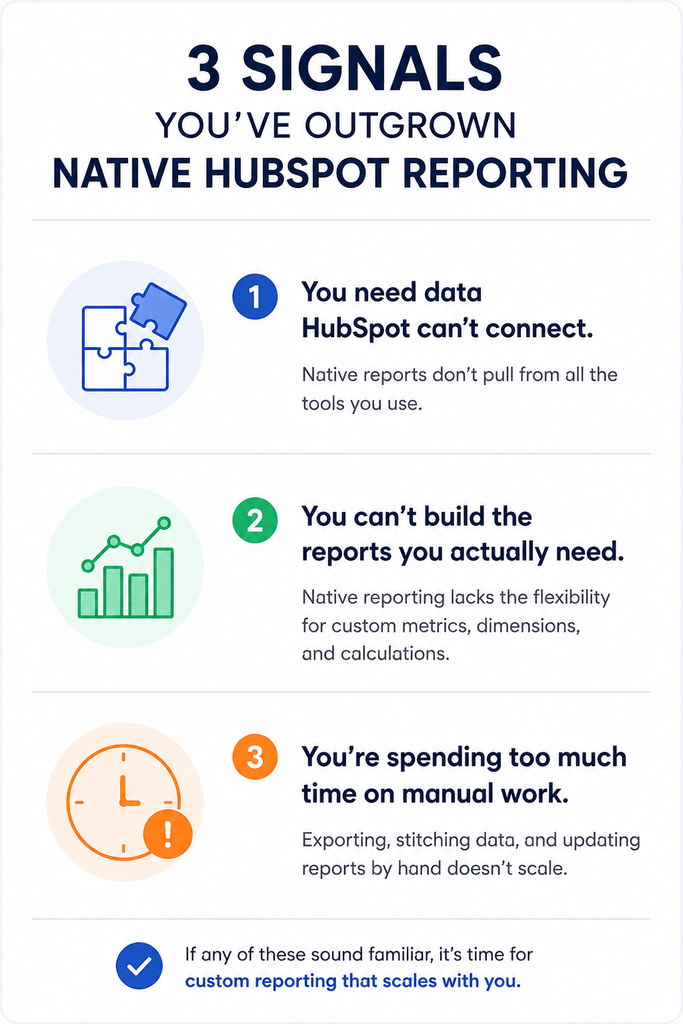
    HubSpot’s report builder is genuinely good for single-object questions like deals by stage, contacts by source, tickets by rep. It starts to strain the moment a question crosses objects or crosses systems.

    A few concrete triggers:

    • Report caps tied to subscription tier. On the HubSpot Community forum, one team had around 20 paid Sales Hub Professional seats. They hit the plan’s 100-report limit. Moving to Enterprise would raise the limit to 3,000 reports, but the team did not need that much capacity. The higher-tier cost also did not make sense for their needs.Their proposed fix, a smaller, cheaper increment instead of an all-or-nothing tier jump, is still just a community suggestion, not a shipped feature.
    • The cross-object ceiling. HubSpot’s documentation confirms that custom report limits vary by subscription. Limits do not combine across multiple hubs on the same tier. Increasing the limit requires a reporting limit add-on, rather than changing a setting.
    • Data outside HubSpot stays outside HubSpot. Revenue collected in Stripe, spend sitting in an ad platform, anything in a warehouse. None of it shows up in a native report without a pre-built integration first.
    • The build itself takes longer than it should. In G2 reviews of HubSpot, users describe dashboards as complex to build in a short window. Getting at the underlying data as something that takes real time spent “connecting the dots” rather than a quick lookup.

    None of this makes HubSpot’s reporting bad. It means native reporting is scoped to what fits inside HubSpot’s object model, and plenty of real reporting questions don’t.

    What Agencies and RevOps Teams Actually Need From a Custom Report

    The keyword is “custom report,” but the actual need is rarely about report types. It’s about specific comparisons:

    • Deal data next to the revenue Stripe actually collected, not just the stage a deal sits in
    • Ad spend next to the pipeline it generated, across a full funnel HubSpot only sees half of
    • The same underlying numbers, reformatted for a client, an exec, and a sales rep without rebuilding it three times

    That’s the actual shape of a “hubspot crm dashboard” request once you strip away the feature vocabulary. It’s a cross-source question wearing a HubSpot label.

    The Old Workaround and Why It Breaks

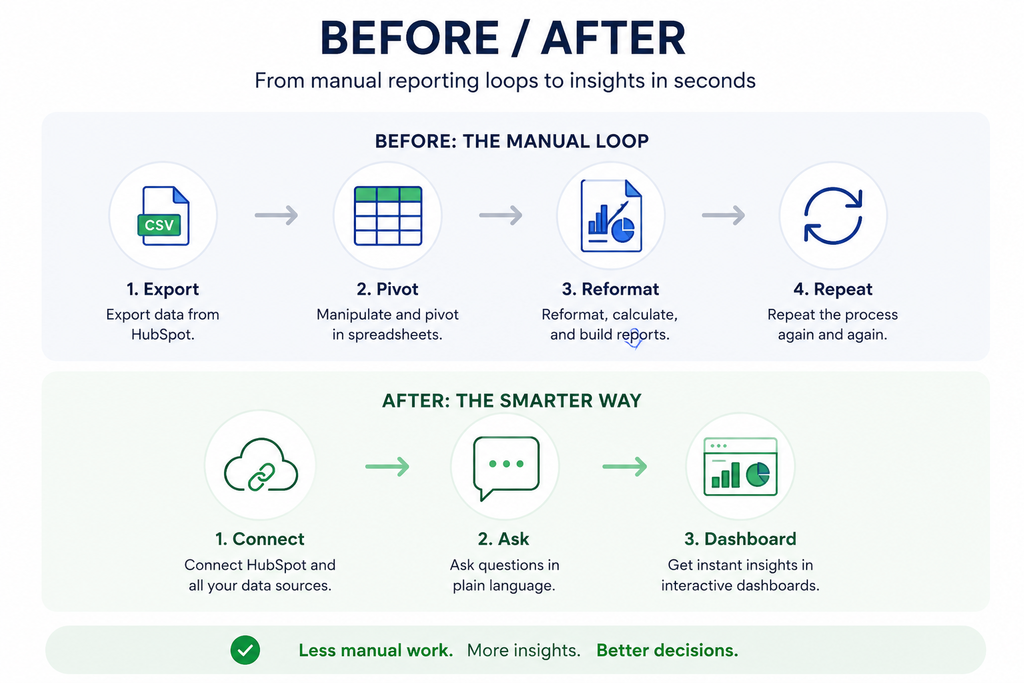
    Before a better tool enters the picture, most teams solve this the same way: export to a spreadsheet, rebuild the pivot table, reformat it for whoever’s asking, send it, and repeat the whole thing next week when the numbers move.

    It works exactly once. Every new question restarts the cycle, the export is stale the moment it’s downloaded, and an agency running this process across multiple client accounts is rebuilding the same pivot table by hand, over and over, for people who just wanted an answer.

    How Papercrane Builds HubSpot Reporting Dashboards Without the Native Limits

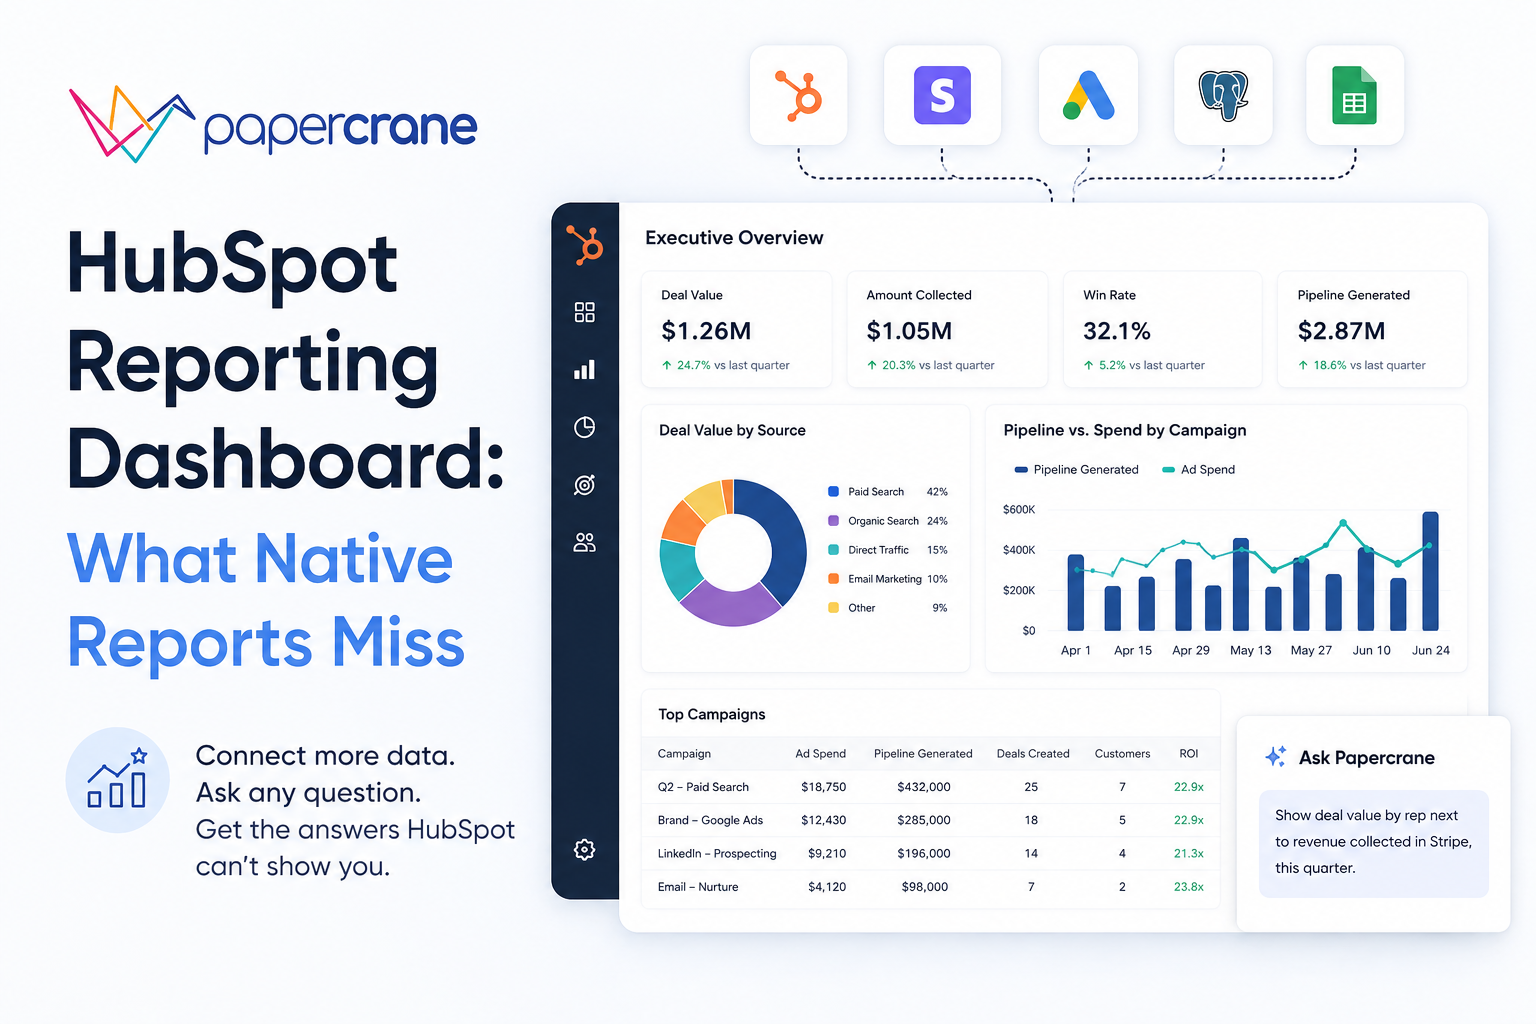
    Papercrane connects to HubSpot alongside your other data sources, such as Stripe, ad platforms, and databases.

    You do not need to pre-build the join logic yourself.

    Instead of configuring axes, filters, and chart types inside HubSpot’s report builder, you describe the report in plain language.

    For example:

    “Show deal value by rep next to revenue actually collected in Stripe, this quarter.”

    Papercrane then builds the dashboard from your request.

    Two follow-up questions often matter more than the first one.

    If the next question is, “Now break that down by lead source,” you ask it directly.

    If you want to ask, “Compare it to last quarter,” you ask that too.

    You do not need to rebuild the report from scratch each time.

    You also avoid limits tied to how many two-axis reports your HubSpot tier supports.

    Cross-object and cross-platform questions become prompts rather than subscription-tier decisions.

    HubSpot Sales Dashboard vs. Marketing Dashboard

    The two use cases need genuinely different data, and both routinely need data HubSpot alone doesn’t have:

    Sales dashboard: pipeline by rep, deal velocity, win rate, joined with revenue actually collected, not just the deal stage marked “closed won.”

    Marketing dashboard: campaign-to-pipeline attribution and spend against the pipeline it produced.

    This gives you the cross-object, cross-platform view HubSpot’s native reporting is least equipped to answer in one place.

    Spend data usually lives in the ad platform, not HubSpot.

    Same underlying need either way: the dashboard should follow the business question, not the object HubSpot happens to store the data in.

    Getting Started in Minutes, Not a Reporting Sprint

    This matters most for agencies managing reporting across several client accounts at once.

    Nobody should need to file a ticket to a dev team or wait for the next sprint to get a dashboard built.

    With Papercrane, an account manager can ask for the dashboard directly, the same way they’d ask a colleague, and get it back in minutes instead of days.

    That’s the practical case for agencies specifically: the reporting bottleneck usually isn’t the data, it’s the queue to get someone to build the report.

    FAQs

    Can I connect HubSpot with non-HubSpot data in one dashboard?

    Yes. Papercrane connects HubSpot alongside sources like Stripe or ad platforms so a single dashboard can report across all of them. HubSpot’s native reporting can’t do without a separate integration built in advance.

    Do I need to upgrade my HubSpot tier to get more custom reports?

    Within HubSpot itself, yes report limits are tied to subscription tier, and increasing them means either upgrading or purchasing a reporting limit add-on, per HubSpot’s own documentation. Building the report outside HubSpot’s report builder sidesteps that limit entirely.

    Can I build a HubSpot dashboard without knowing SQL or the report builder’s filter logic?

    Yes, with Papercrane you describe what you want in plain language rather than configuring data sources, fields, and filters manually.

    Ready to see it on your own data?

    Connect your HubSpot account and ask for the dashboard you’ve been exporting to a spreadsheet every week, or see how agencies use Papercrane to handle reporting across every client account from one place.