Category: Analytics Dashboards

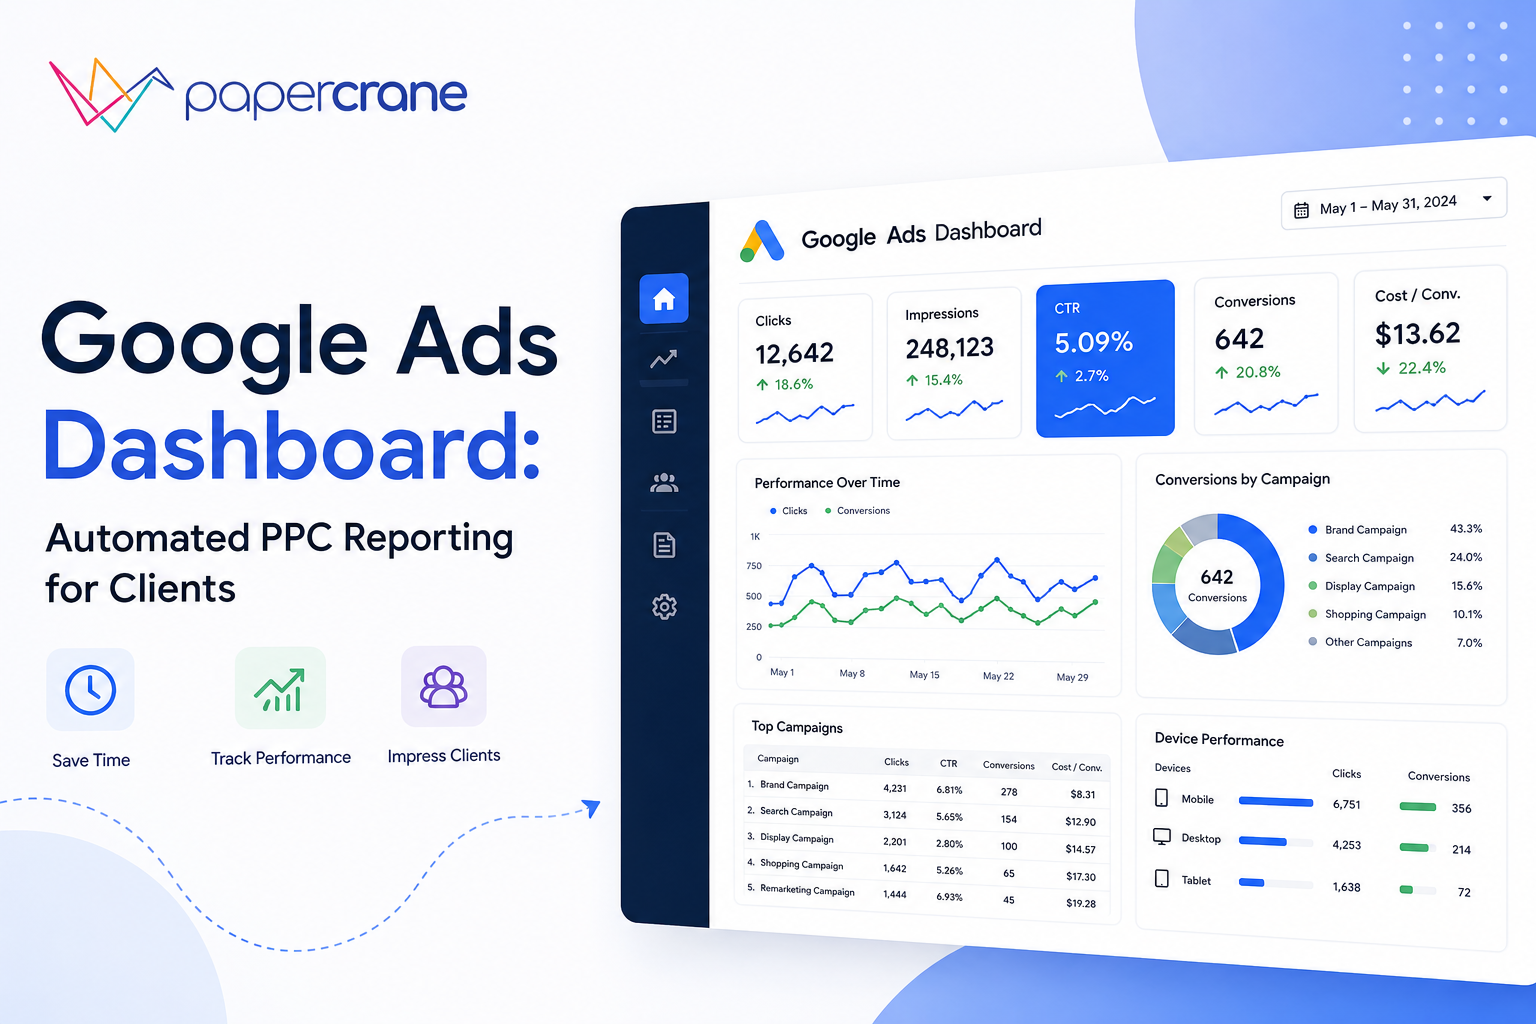
  • Google Ads Dashboard: Automated PPC Reporting for Clients

    Google Ads Dashboard: Automated PPC Reporting for Clients

    A client messages you at 4:47pm on a Friday: “Why did conversions drop this week?” You have the answer somewhere, across three MCC accounts and a spreadsheet you last updated on Tuesday. By the time you’ve exported CSVs and rebuilt the chart, the client has already drawn their own conclusion.

    This is the actual problem a google ads dashboard is supposed to solve for agencies not “tracking metrics in one place”. If your reporting setup can’t do that, it’s not a dashboard. It’s a delay with a nicer font.

    Why the Standard Google Ads Dashboard Breaks Down for Agencies

    Google’s native interface was built for one advertiser looking at their own account, not an agency managing twenty. The MCC view isn’t client-safe, you can’t hand a client a login without exposing every other account you manage.

    There’s no white-labeling, no automated client-facing export, and every time Google rolls out a redesign, saved views and custom columns can shift or disappear without warning.

    Some people still search for this under its old name, the adwords dashboard but the limitation hasn’t changed with the rebrand: it’s an internal tool, not a client communication tool.

    If you want your Google Ads account feeding a system built for sharing, not just viewing, you can connect your Google Ads account directly rather than exporting from the native interface. For reference on what the native interface actually supports, Google’s own Ads Help Center documents the current dashboard layout is worth checking before you assume a feature exists.

    The Real Cost: Hours, Not Just Hassle

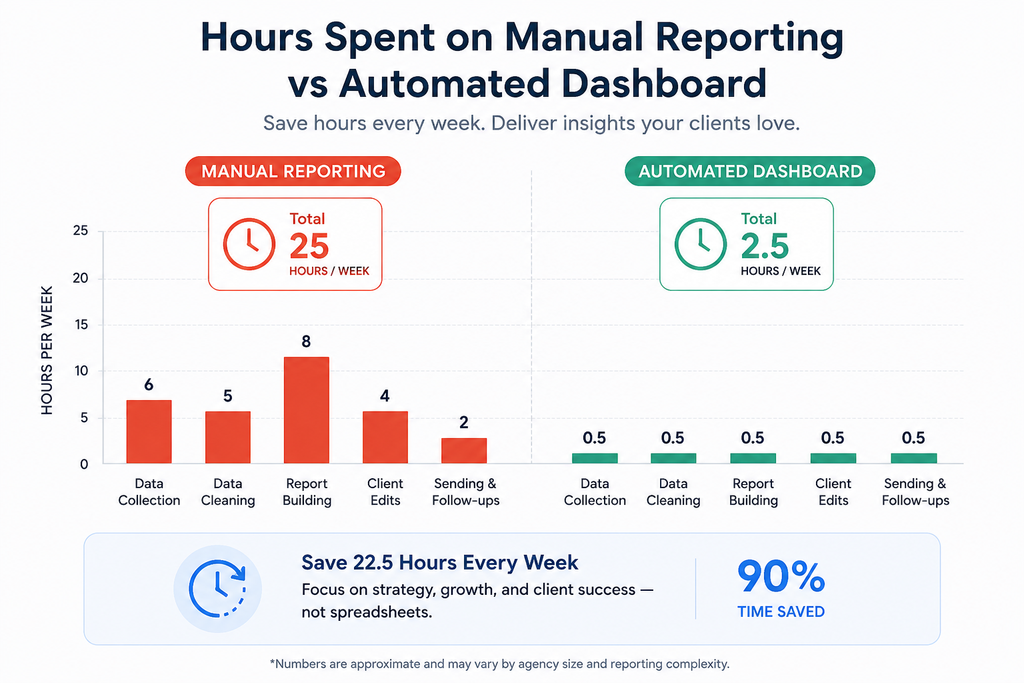
    Agencies that cross roughly 10 hours a week on manual reporting are already past the point where a spreadsheet makes sense.

    That’s not a rule of thumb, it’s the threshold where the labor cost of manual google ads reporting exceeds what a reporting tool costs to run. Every hour spent formatting a slide deck is an hour not spent adjusting bids, testing ad copy, or catching a budget pacing issue before it burns through spend.

    Multiply that by every client on your roster, and “we’ll just export it manually” stops being a scrappy habit and starts being the reason your best account manager is doing data entry instead of strategy.
    The Trust Problem. Not Just the Time Problem

    Here’s what most articles on this topic miss: clients don’t churn because performance dipped. They churn because they felt out of the loop when it did. A monthly report is a monologue, you talk, they listen, and for the 29 days in between, they’re guessing. A live ppc dashboard changes that dynamic entirely. Instead of “prove it to me at the end of the month,” the client can check in whenever they want, which means the conversation you have on a call is about strategy, not about defending a number they’re seeing for the first time.

    This is the gap most Google Ads dashboard content ignores. Metrics matter, but access to metrics on the client’s schedule, not yours is what actually protects the relationship.

    What a Proper PPC Dashboard Actually Needs

    A dashboard that’s built for agency-client reporting, not just personal account tracking. It needs to cover a few non-negotiables:

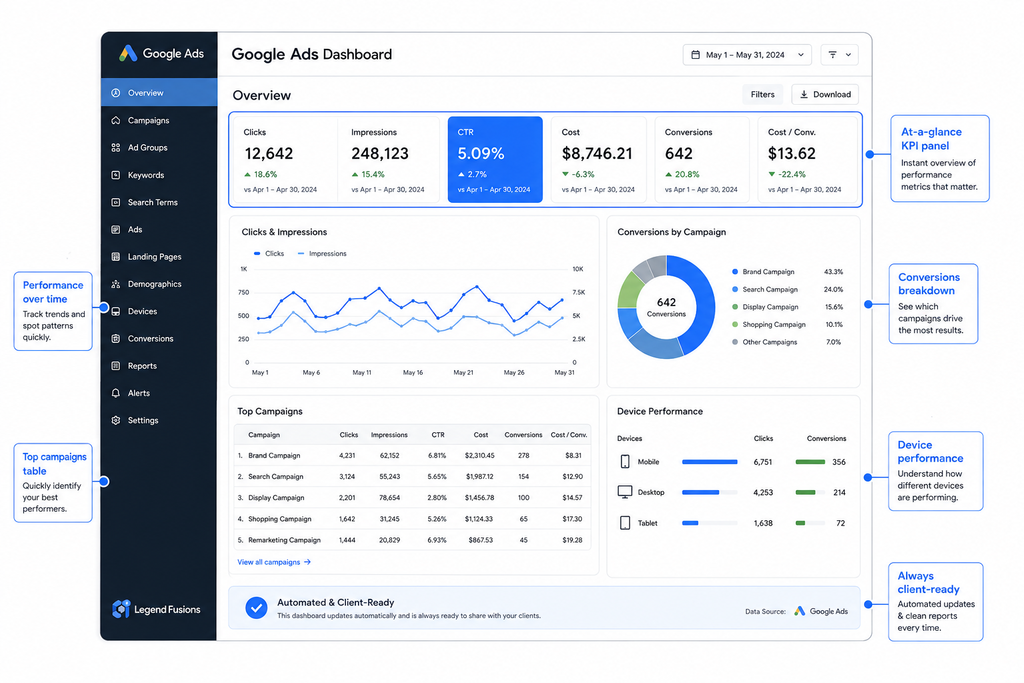
    • The right KPIs, not vanity metrics. A google ads kpi dashboard should surface CPA, ROAS, conversion rate, and pacing against goal. It is not just about impressions and clicks, which look good and mean little.
    • Live data, not stale exports. If the client is looking at numbers from three days ago, you haven’t solved the trust problem, you’ve just made the delay prettier.
    • White-labeling without asterisks. Many tools gate full brand removal like custom domain, custom sender, and no vendor logo, behind a higher-priced tier. Check this before you commit, not after a client spots someone else’s logo on your report.
    • Multi-client, multi-account support. Agencies need to move between accounts without re-authenticating or rebuilding views from scratch.
    • Anomaly alerts. A ppc reporting dashboard that only reports monthly can’t warn you about a budget pacing issue on day 4.
    How Papercrane Closes These Gaps

    Papercrane connects directly to your Google Ads account through the API, no CSV exports, no manual copy-paste into slide decks. Every agency client gets a fully white-labeled google ads performance dashboard, with no gated tier hiding your own branding behind theirs.

    The setup is three steps:

    1. Connect your Google Ads account (and any others you manage).
    2. Select KPIs relevant to that client’s goals, using pre-built templates or a custom view.
    3. Share a live link, or schedule automated email or Slack digests on whatever cadence the client actually wants.

    Want to see what’s actually included versus what’s gated elsewhere? See how white-label reporting works for agencies for a closer look. And if you want the technical detail on what a direct API connection can pull that a manual export can’t, Google’s Google Ads API documentation covers the data available at that level.

    FAQ

    What is a Google Ads dashboard?

    A Google Ads dashboard is a visual interface either Google’s native tool or a third-party platform. It displays campaign metrics like clicks, conversions, CPA, and ROAS in one place instead of raw account data.

    How do I create an automated Google Ads report for clients?

    Connect your Google Ads account to a reporting platform via API, select the KPIs relevant to the client, and schedule automatic delivery by live link, email, or Slack. No need of manually building reports each period.

    Is a Google Ads dashboard the same as an Adwords dashboard?

    Yes. Google Ads was formerly called Google AdWords, so “Adwords dashboard” and “Google Ads dashboard” refer to the same tool under its old and current names.

    How much time does automated PPC reporting save?

    Agencies manually building reports typically spend several hours per client each week; automated dashboards remove most of that by pulling live data directly instead of requiring manual exports and formatting.

    What’s Next?

    A google ads dashboard built for agencies isn’t about prettier charts. It’s about giving clients access before they have to ask, and giving your team back the hours currently lost to formatting instead of optimizing.

    Start your free Google Ads dashboard and see the difference between a report a client waits for and one they can already see.
  • GA4 Dashboard: Custom Reports Without Looker Studio

    GA4 Dashboard: Custom Reports Without Looker Studio

    You already have the data in Google Analytics 4. The problem is getting the exact answer you need without spending another 20 minutes clicking through reports, changing dimensions, adding filters, or building another dashboard.

    A GA4 dashboard should reduce that work, not become another reporting project.

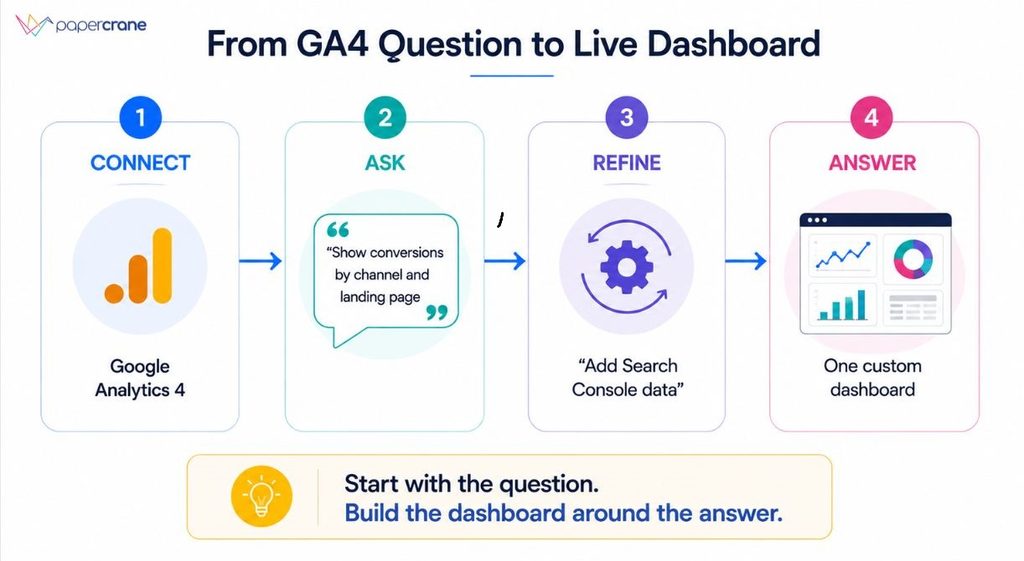
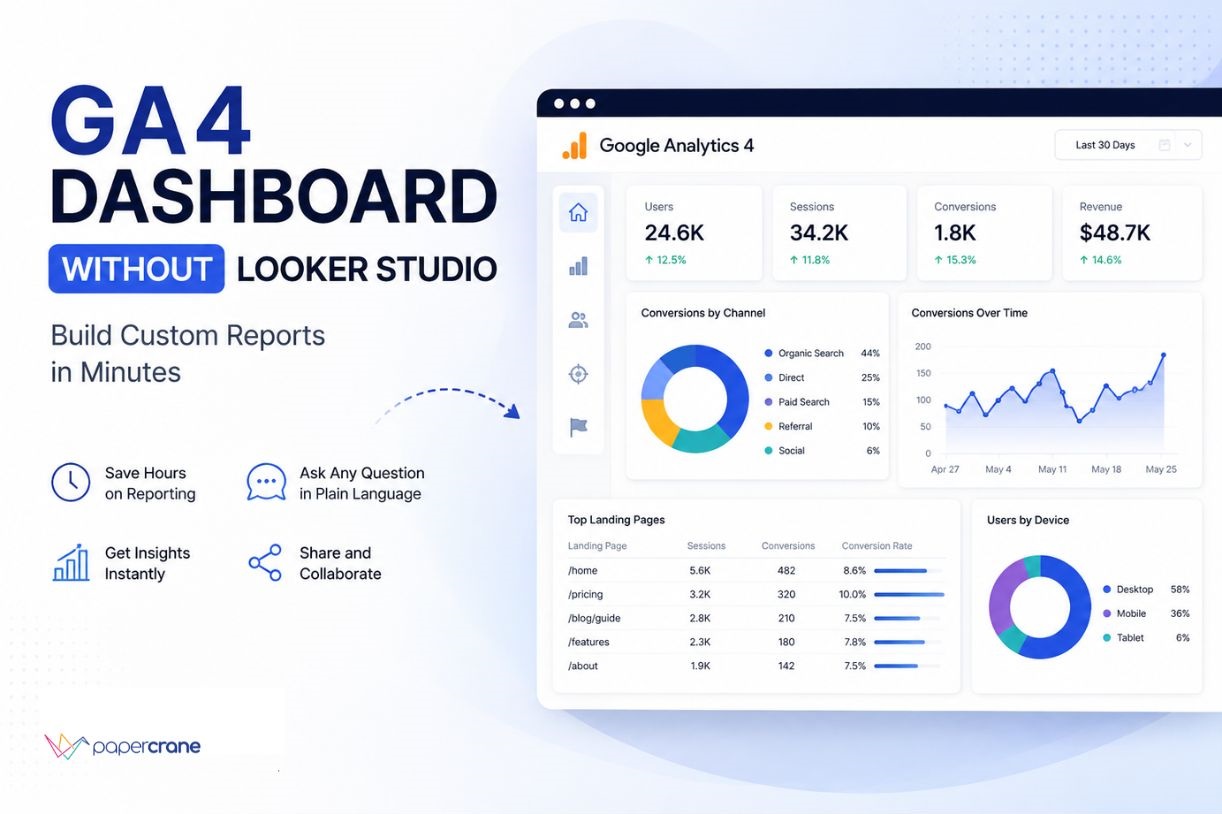
    Papercrane gives you a different workflow. Connect GA4, describe the report you need, and build a custom dashboard around the questions your team asks every day.

    Why Does GA4 Reporting Take So Much Time?

    GA4 gives you a lot of control over reports. You can change dimensions, add metrics, apply filters, customize charts, and create custom reports. Google also provides Explorations for more flexible analysis.

    The problem is the amount of work between your question and the answer.

    Say you want to know:

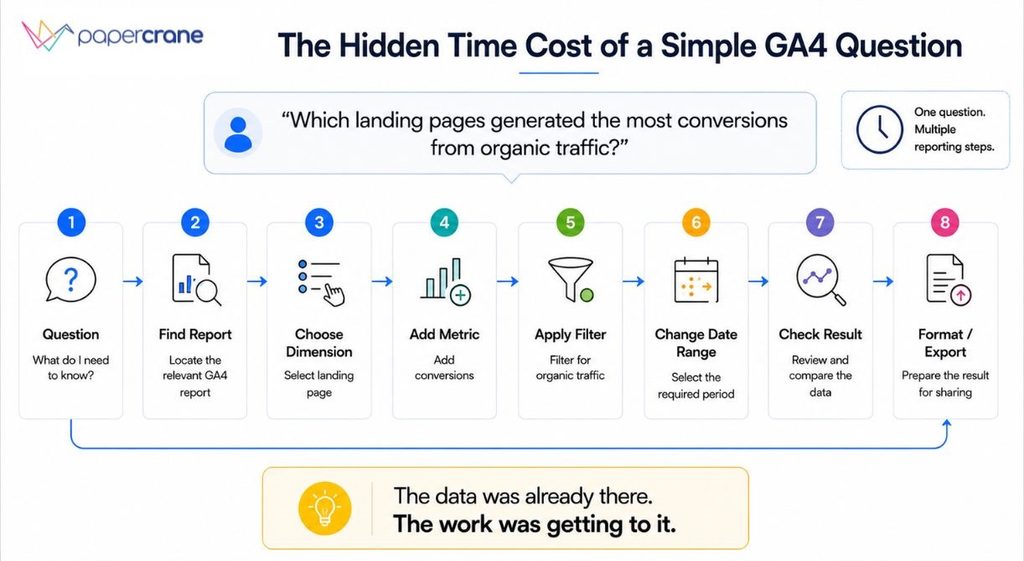
    Which landing pages generated the most conversions from organic traffic in the last 30 days?

    You might need to:

    1. Find the relevant GA4 report.
    2. Select the right landing-page dimension.
    3. Add the conversion metric.
    4. Filter the data to organic traffic.
    5. Set the date range.
    6. Compare the previous period.
    7. Sort the results.
    8. Format or export the report.

    GA4 supports these types of customizations. The issue is that you still have to configure them.

    This becomes frustrating when the question changes every day.

    One day you need landing-page conversions. The next day you need channel performance. Then someone asks which pages lost conversions compared with last month.

    The data is already there. You keep rebuilding the path to it.

    What Happens When Reporting Takes Longer Than the Analysis?

    The first problem is time.

    If you spend 20 minutes building or checking a custom report three times a week, that is about four hours a month on one recurring reporting task.

    For an agency doing similar work across 10 clients, the same example becomes about 40 hours a month.

    Those figures are an example, not a Papercrane performance claim. Your actual time depends on your reporting process.

    The bigger problem is what happens around that time.

    Your analysis gets pushed back

    If your reporting process takes most of the available time, you have less time to ask why performance changed.

    You end up preparing numbers instead of interpreting them.

    Simple questions become requests

    A manager asks:

    “Why did conversions drop last week?”

    Instead of answering during the meeting, you say you will pull the numbers and come back later.

    The question was simple. The reporting process was not.

    Your reporting depends on the person who knows GA4

    Someone has to know where the data lives, which dimensions work together, which filters to use, and how to structure the report.

    When that person is busy, reporting slows down.

    You keep maintaining the same reports

    Even after you build a useful report, your questions change.

    A new metric gets added. A new breakdown is needed. Someone wants a different comparison.

    Google does support copying custom reports and Explorations across properties, which helps reduce repeated configuration. But copied configurations are snapshots. Changes to the original do not flow into the copy.

    This is the reporting problem many teams miss.

    The issue is not whether GA4 has enough data.

    It is how much work it takes to turn that data into the view you need today.

    Does Looker Studio Solve the GA4 Reporting Problem?

    Looker Studio is useful when you need a structured reporting layer around your data. Google supports connecting Analytics data to Looker Studio, and GA4 reports can also be shared or exported directly.

    But Looker Studio does not remove every reporting task.

    You still need to decide:

    • Which GA4 data to use
    • Which dimensions and metrics matter
    • Which filters to apply
    • Which charts to build
    • How the report should be arranged
    • What needs to change when the reporting question changes

    This works well when you need a fixed report.

    For example, an agency might build one monthly client report with:

    Traffic → Acquisition → Landing Pages → Conversions → Revenue

    Once the structure is agreed, keeping the same report each month makes sense.

    The problem starts when the question changes.

    “Add organic traffic.”

    “Show conversions by landing page.”

    “Compare this month with the previous six months.”

    “Break this down by device.”

    Each request can turn into another reporting task.

    So the question is not whether a GA4 Looker Studio dashboard works. It does.

    The question is whether you want every new reporting question to go through the dashboard-building process.

    What If You Could Ask for the GA4 Dashboard You Need?

    This is where Papercrane takes a different approach.

    Papercrane’s Google Analytics 4 integration is built for custom dashboards beyond the standard GA4 interface. It supports real-time and historical data, event and conversion tracking, audience segmentation, and custom report building.

    Instead of starting with a blank dashboard, you start with the question.

    For example:

    “Build a GA4 dashboard showing traffic, engagement rate, key events and revenue by channel. Compare the last 30 days with the previous 30 days.”

    You can then refine it:

    “Add the top landing pages.”

    Then:

    “Show only organic traffic.”

    Then:

    “Add a six-month conversion trend.”

    The dashboard changes around the question.

    You are still deciding what you want to see. Papercrane handles the dashboard-building workflow around your request.

    The difference is simple

    Traditional workflow:

    Question → Find the report → Configure the data → Build the charts → Adjust the layout → Get the answer

    Papercrane:

    Question → Ask → Refine → Get the answer

    That difference matters when your reporting questions change often.

    What Does This Look Like in Real Life?

    Consider a marketing manager reviewing weekly performance.

    They want to know:

    “Which channels brought the most conversions this week, and which landing pages contributed?”

    With a traditional workflow, they might move through GA4 reports, change the date range, filter channels, check landing pages, and compare the previous period.

    With Papercrane, they can ask for the view directly.

    The same applies to an agency preparing a client report:

    “Show organic traffic, landing-page engagement and conversions this month compared with last month.”

    If the agency also needs search performance, it can bring Google Search Console into the analysis.

    For example:

    “Add Search Console clicks and impressions alongside GA4 organic sessions and conversions.”

    You can connect Google Search Console through Papercrane’s integration alongside Google Analytics.

    Connect Google Search Console

    The useful part is not the number of charts.

    It is the shorter distance between the question and the answer.

    What Do You Save With a Custom GA4 Dashboard?

    The biggest benefit is not a claim of “X hours saved.”

    Your actual saving depends on how much reporting work you do today.

    The practical gains come from removing repeated steps.

    Less report setup

    You describe the view you need instead of manually building every part of it.

    Faster changes

    A new question does not automatically mean creating another report from scratch.

    Less dashboard maintenance

    Your reporting workflow starts with the questions your team needs answered, rather than a fixed collection of charts.

    More time for analysis

    Instead of spending your time arranging metrics and filters, you have more time to understand what changed and what deserves attention.

    Faster answers during meetings

    When someone asks a new question, you have a shorter path from the request to the data.

    That is the real outcome.

    You are not trying to collect more analytics.

    You are trying to spend less time getting to the analytics you already have.

    When Should You Use Papercrane Instead of Looker Studio?

    Looker Studio still makes sense for some teams.

    Use a GA4 Looker Studio dashboard when you need:

    • A fixed recurring report
    • Detailed visual formatting
    • A highly controlled report layout
    • A reporting workflow your team already has in place

    Papercrane makes more sense when:

    • Your reporting questions change frequently
    • You need custom reports without rebuilding each one manually
    • You want to describe the dashboard in plain language
    • You want to combine GA4 with other data sources
    • Your team spends too much time creating and maintaining reports

    You also do not have to choose based on the assumption that one tool replaces every other analytics tool.

    The better question is:

    How does your team want to work with its data?

    If your answer is “build one report and keep using it,” Looker Studio remains a strong option.

    If your answer is “we keep asking new questions,” an AI dashboard Builder workflow fits better.

    How Do You Build a GA4 Dashboard With Papercrane?

    The process is simple.

    1. Connect Google Analytics 4

    Connect your GA4 property to Papercrane.

    Connect Google Analytics 4

    2. Ask for the dashboard

    Start with the business question.

    For example:

    “Build a GA4 dashboard showing traffic, engagement, conversions and revenue by channel. Compare monthly performance and show the landing pages driving the biggest changes.”

    3. Refine the result

    You can then ask for changes such as:

    “Add organic traffic from Search Console.”

    “Show conversion rate by landing page.”

    “Add a six-month trend.”

    “Highlight the biggest month-over-month drops.”

    The workflow stays focused on what you need to understand.

    What Should Your GA4 Dashboard Help You Answer?

    A useful GA4 dashboard should help you answer questions such as:

    • Which channels are producing conversions?
    • Which landing pages turn traffic into results?
    • Where did performance change?
    • What changed compared with the previous period?
    • Which areas need investigation?

    If answering those questions still means opening GA4, finding the right report, configuring an Exploration, checking another reporting tool, and updating a dashboard, the problem is no longer a lack of data.

    It is the reporting workflow.

    Papercrane gives you a different way to work. Connect your GA4 data, ask for the view you need, and refine it as your questions change. Build a custom GA4 dashboard with Papercrane

    FAQs

    Can I create a custom GA4 dashboard?

    Yes. GA4 lets editors and administrators create and customize detail reports, including dimensions, metrics, filters and charts.

    Do I need Looker Studio for a GA4 dashboard?

    No. GA4 includes customizable reports and Explorations. Looker Studio provides a separate reporting and visualization layer.

    What is a GA4 Looker Studio dashboard?

    It is a Looker Studio report connected to Google Analytics data. It is useful for teams that need structured, reusable reporting views.

    What should a GA4 dashboard include?

    Choose the metrics and views based on the questions your team needs to answer. Common areas include traffic, acquisition, landing pages, engagement, key events and conversions.

    Is Papercrane a replacement for GA4?

    No. GA4 remains the source of your Google Analytics data. Papercrane provides a separate way to build and work with custom dashboards using connected data.